 ,
,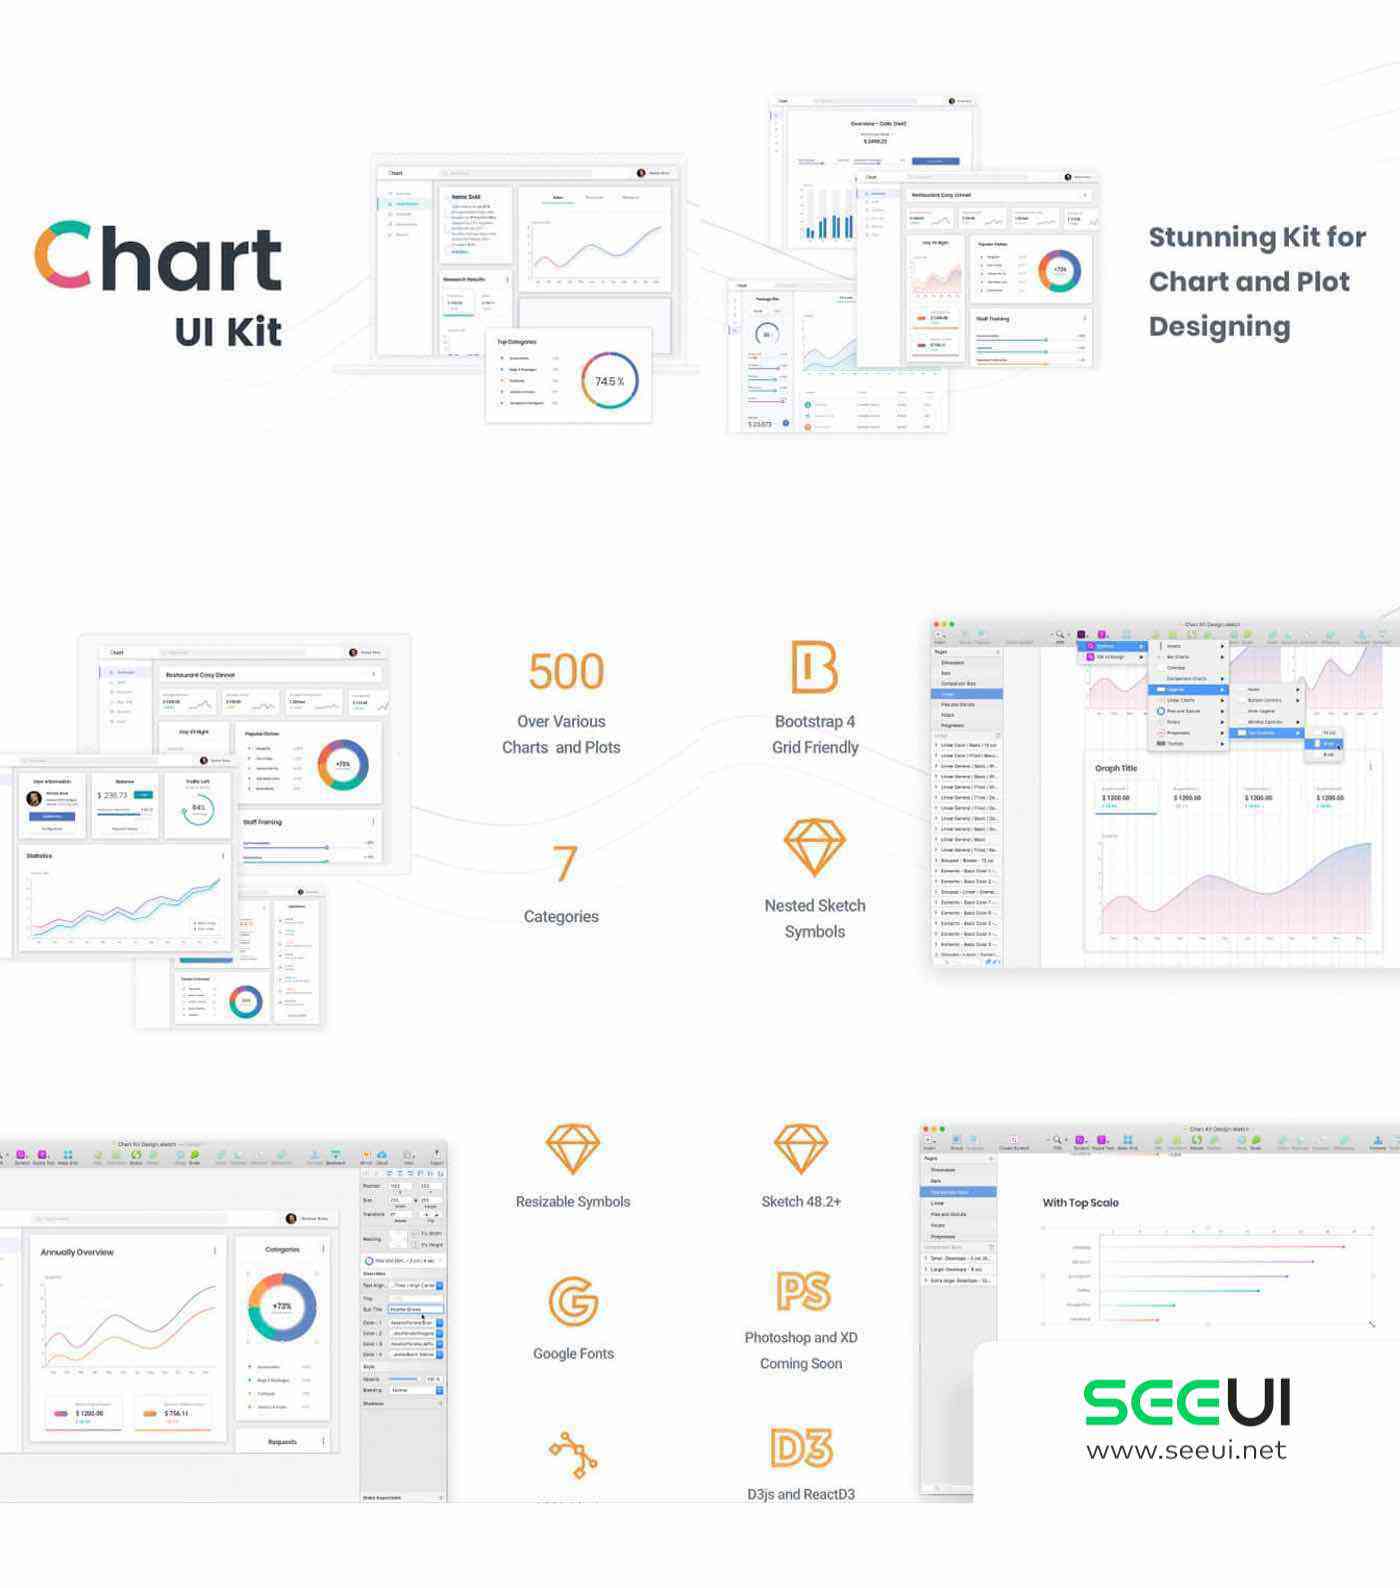
 图表套件是一个由7个类别的500多个各种图表和绘图组成的集合,将满足你的数据表现设计的所有需求。 特点。设计更快 – 为管理面板、仪表盘、信息图和分析软件(金融、电子商务、比特币)创建优雅和现代的设计。图表套件集合包含了所有最流行的图表类型–只需选择你需要的并与你的UI设计相结合。 – 易于定制。极简的对比设计很容易更新和定制,以适应你的界面设计和风格指南。从字面上看,一切都可以改变和更新以适应你的要求。 – 填写真实数据。所有的符号元素都是嵌套的,可以定制文本、颜色和布局。让你的数据在2分钟内显示出来! 里面有什么? 500多个元素的集合,按7个类别分类,可用于符号库和艺术板。每个元素都被很好地组织和命名。还包括30多个展示屏幕。条形图、比较图、线性图、馅饼和甜甜圈、柱状图、进度图、日历、图例、工具提示、展示屏、其他。
Chart Kit is a collection of 500+ various charts and plots in 7 categories that will meet all the needs of your data representation design. Features: Design Faster – Create elegant and modern design of Admin Panels, Dashboards, Infographics and Analytics software (finance, e-commerce, bitcoins). Chart Kit collection contains all the most popular types of graphs and diagrams — just select ones you need and combine with your UI design. – Easy Customizing: Minimalistic contrast design is easy to update and customize to fit your interface design and style guides. Literally everything can be changed and updated to suit your requirements. – Fill in with Real Data: All symbol elements are nested to customize texts, colors and layouts. Have your data displayed in 2 minutes! What is inside? Collection of 500+ elements sorted by 7 categories available on symbol library and art boards. Every element is well organized and named. 30+ showcase screens are also included: Bar Charts, Comparison Charts, Linear Charts, Pies and Donuts, Polars, Progresses, Calendars, Legends, Tooltips, Showcases, Other.






评论0